Part of my role at Forge and Smith is coaching our clients on digital strategy to support their new business websites. I love helping people learn the ins and outs of Google Analytics to assess website performance and visitor engagement. But there are aspects of the data that can be badly misread – or totally hidden. Don’t be fooled! Here are my advanced Google Analytics tricks for better accuracy in your reporting.
Post Contents
Trickery #1: Session Duration is a Lie
The first data table most of us see when using Google Analytics is the Audience Overview. It’s right up there at the top, the first option after Realtime reporting. This snapshot gives you a great quick-and-dirty look at your website performance by traffic and visitor engagement.
One of the engagement data points it captures is average session duration.
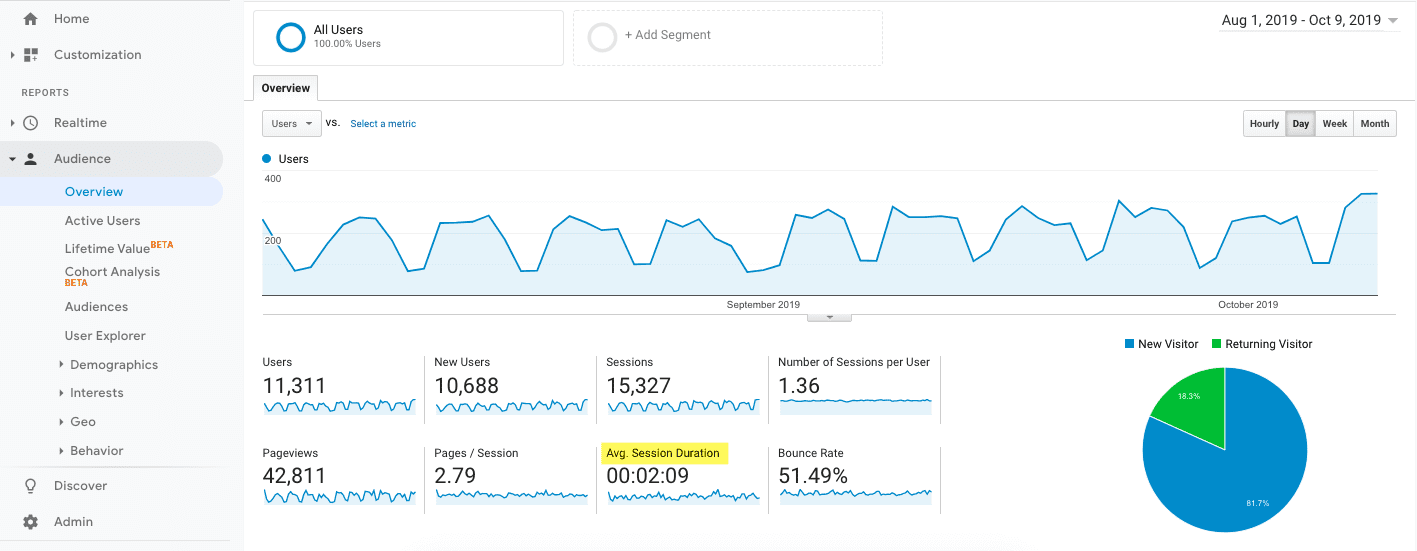
At a glance, this appears to tell you how long the average person spends on your website. That’s what it says, isn’t it? And it’s right there with all the other valuable top-level data, so it must be important! But that’s not how this number is calculated, and it’s not actually useful.
Average session duration is calculated by Google Analytics based on how long some people spend on your website. It adds up all of the session durations for all content during the given period, and averages it. The problem is the way it factors bounce sessions.
Quick recap from my post on how to learn Google Analytics basics: a bounce is when someone exits your website without taking a second action. Scrolling is not an action, so if someone spends five minutes reading a post then exits, it is a bounce. And bounce sessions are recorded as 0 seconds.
Do you see the problem? If 51% of site visitors bounce, and all of those sessions are recorded as 0 seconds, then 51% of the data used to calculate your site’s average session duration is way lower than it should be.
Advanced Google Analytics workaround #1
Don’t put weight on average session duration when you’re assessing website performance. Focus instead on the dwell times (average time on page) for each piece of content, found in the Behaviour > Site Content > All pages report.


While exits from that page or post are still recorded as 0 seconds spent on page, Google Analytics doesn’t include exits when it calculates this average. The lower the exit rate, the more accurate this number will be.
Here are three other ways to improve your time tracking:
-
- Always include lateral navigation opportunities to entice visiting another page – linked text and large callouts to related content within copy, and clear primary and footer navigation
- Configure a scroll depth event in Google Tag Manager to gather insight on how far down the page everyone gets, including bounced sessions
- Configure an adjusted bounce rate to force Google Analytics to count all sessions of a certain duration or longer
Trickery #2: Goals and Events Show Different Totals
Google Analytics provides awesome ways to track the visitor actions that are most valuable to your company’s unique goals. This is done through Goals and Events.
Goals are where you want to track the big ticket actions: completed purchases, viewing a “thank-you” page after a form completion, and maybe downloading content.
Here’s the problem: goals are logged per session, but only one conversion is recorded per goal. If a visitor to your site completes the same goal two or three times, it will only be counted once.
In many cases the customer isn’t going to do that – they wouldn’t fill out your contact form twice in a row, or download the same piece of content in one session. But there are tons of instances where someone could take the same action multiple times.
-
- They forgot to put something in their cart and remembered after checkout
- They saw something else they liked after checkout
- They’re shopping for both personal and work items, using two different credit cards
- The goal is an action that can be taken on multiple products or pages
We have a retail client with a site goal to click the “Buy Now” button and discover where to find their products in nearby stores. It’s a great goal, because their site isn’t set up for eCommerce, and this is how they can see data on how many people want to buy their products (and which ones).
It’s set as an event goal, to match the configuration of the Buy Now button click event in Google Tag Manager.
Here’s a look at their Buy Now goal completions:


And here’s the Buy Now button click total for the exact same period:


Whaaaaaat?!
There’s a huge difference between 993 and 547 customer actions. This is why goals can’t always be trusted.
Advanced Google Analytics workaround #2
Get comfy with Google Tag Manager, and make sure all of your biggest goals are linked to events. That way you can compare numbers and get the most accurate data.
Events are also perfect for smaller actions that you want to track. Here are examples of events for which I’ve helped configure event tracking, to illustrate the scope of possibilities:
-
- Scroll depth
- Outbound link clicks
- Social media shares or social profile clicks
- Video plays, pauses, completions
- Email subscriptions from a footer menu vs. a pop-up window
- Clicks to view reviews
- Resource downloads
- Clicks to email or phone the company
- Clicks to “refer a friend”
- Where to buy/store locator button clicks
- Chatbot usage
- Taking a quiz
You can use events to build goals, or enjoy them by themselves. Google Analytics allows up to 20 goals, and unlimited events. Both goals and events are amazing for analyzing how well different traffic sources, devices, or audience locations contribute to conversions.
Trickery #3: Social Media Traffic is Hidden
Where do you think you’ll find your social media traffic in Google Analytics? Probably under Acquisition > All Traffic > Channels:


You can also find it in its own tab, under Acquisition > Social > Network Referrals:


That’s fine perfectly fine if the only social media traffic your business gets is from straight-up social media posting and clicks to the link in your bio.
If you do boosted posts, CPC campaigns, or use Google’s custom UTM builder for ultra-granular post tracking, that traffic is not in the social section of the dashboard.
Where the heck is it?
It’s buried in a smattering of places: Social, Campaigns, and that mysterious (Other) channel grouping:


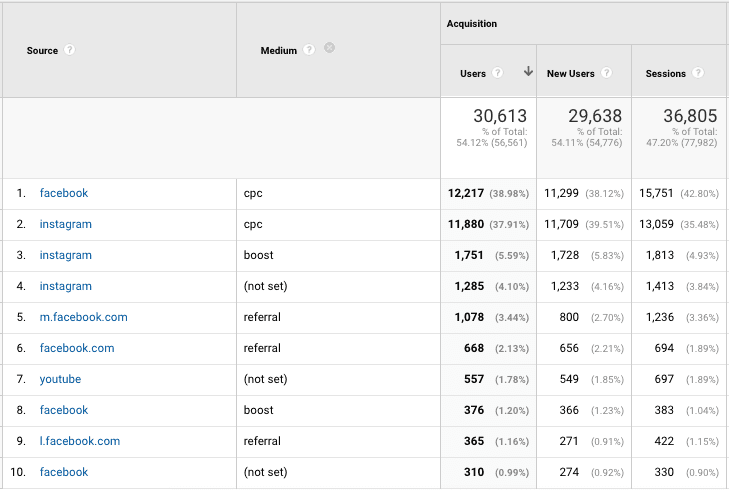
You can view all social traffic in the Source/Medium report found in the same section of the dashboard, but it will be mixed in a long list of other sources and you’d have to apply a lot of filters to see just social media. Forget that!
Advanced Google Analytics workaround #3
I admit, this was a ridiculously fun solve for me when I first discovered the solution. By building a custom channel grouping, every time you want to see your social traffic it will be in one tidy place.
Navigate to your Admin panel, and under the View Settings you’ll find Custom Channel Grouping.
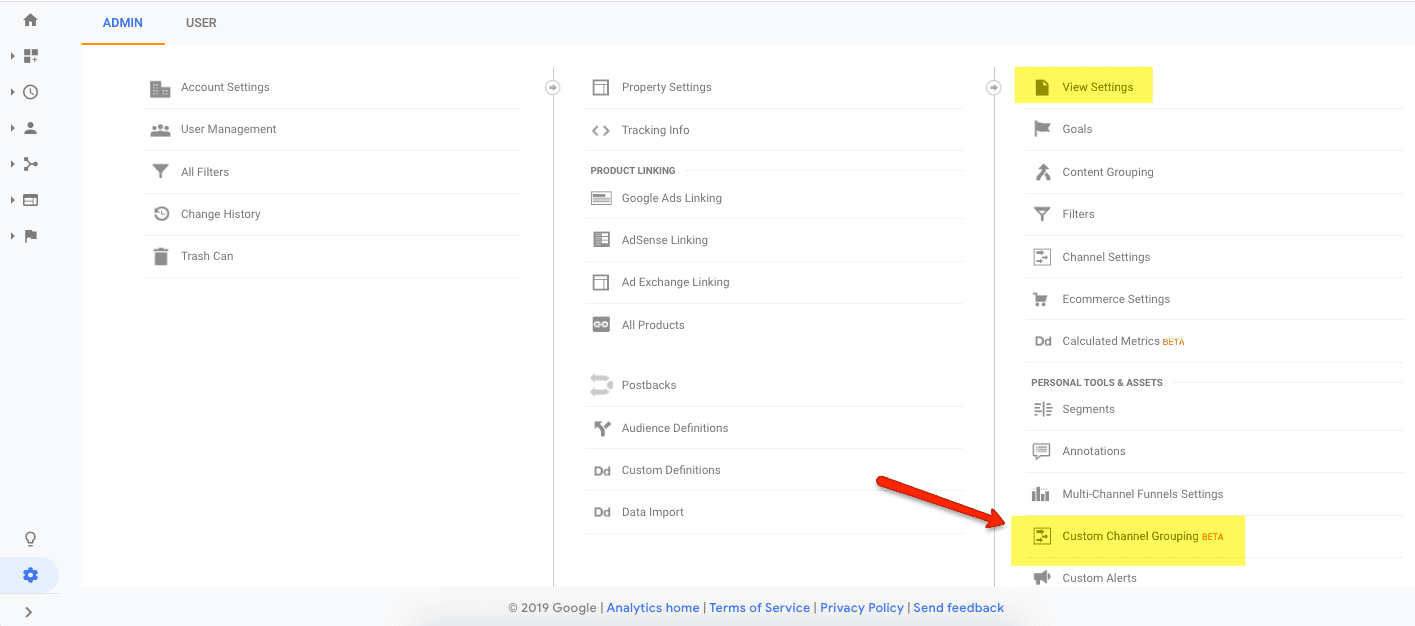
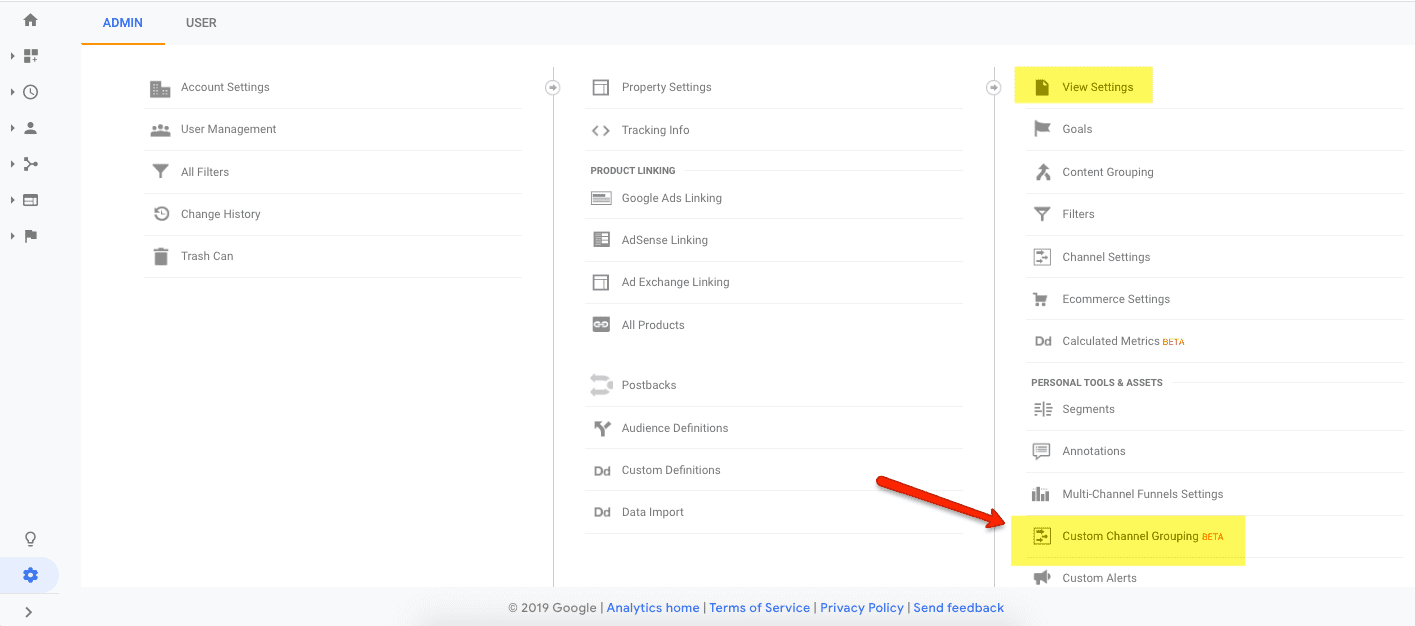
Click +New Channel Grouping, and you’re ready to begin!
You need to know all of the possible social media traffic sources your business website gets, to input into the new grouping. I found the easiest way is to have another tab open with Google Analytics, and set your date range back as far as you can to pool all potential sources.
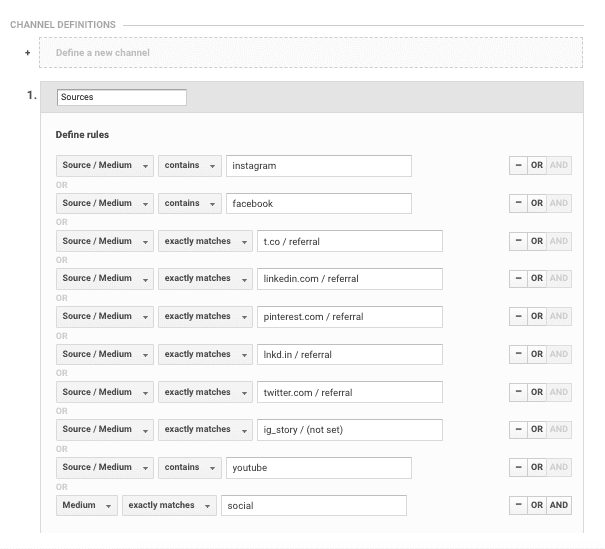
You already know the big ones: Facebook, Instagram, LinkedIn, Pinterest, YouTube, Twitter. You just need to keep an eye out for others that factor into your company’s digital strategy.
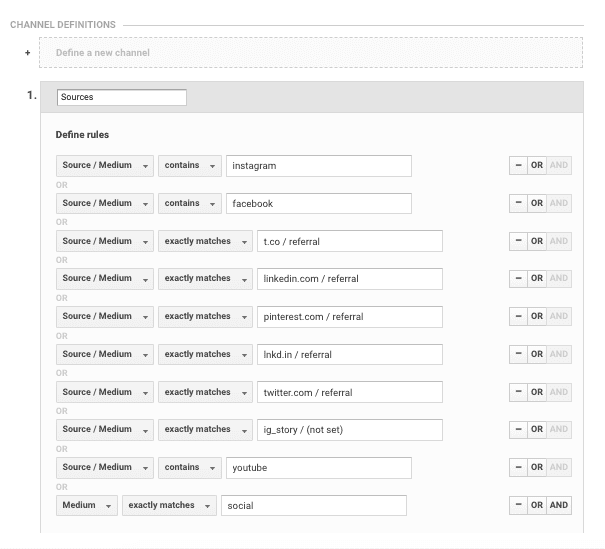
First, name your new channel. Mine is called “All Social”, because that’s literally what it is. Keep it simple.
Next, you’ll define your channel by adding sources. You can use regular expressions, but you don’t have to. Simply use the first drop-down to set Source/Medium.
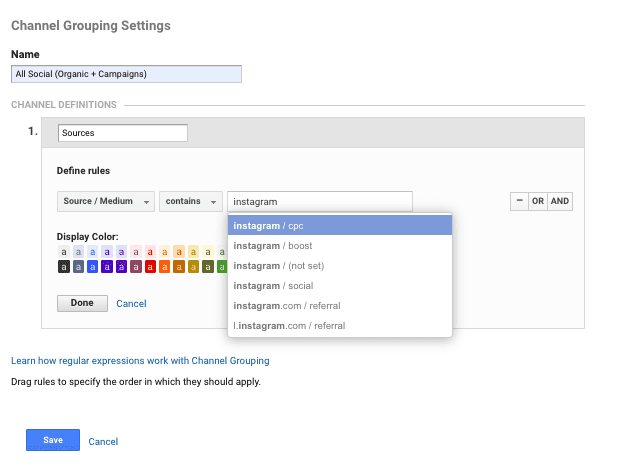
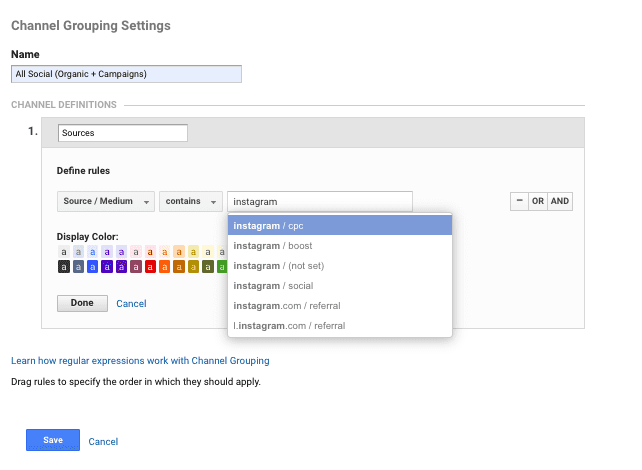
You can use “exactly matches” for social channels that only ever come from one or two sources, like LinkedIn (linked.com and lnkd.in) and Twitter (twitter.com and t.co). You’ll want to choose “contains” as a catch-all for channels like Instagram and Facebook, which have a multitude of variations on source/medium.
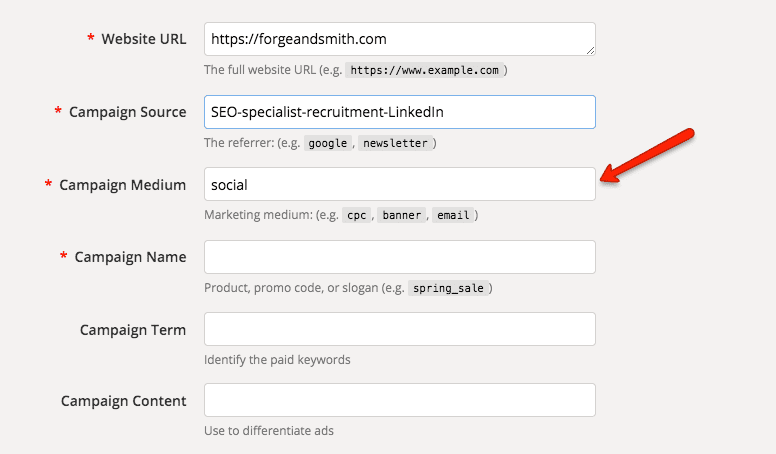
I also used a Medium with “exactly matches” and “social” – this way if you always set the Medium as “social” when building custom UTMs to track specific posts, they’ll turn up in this grouping.
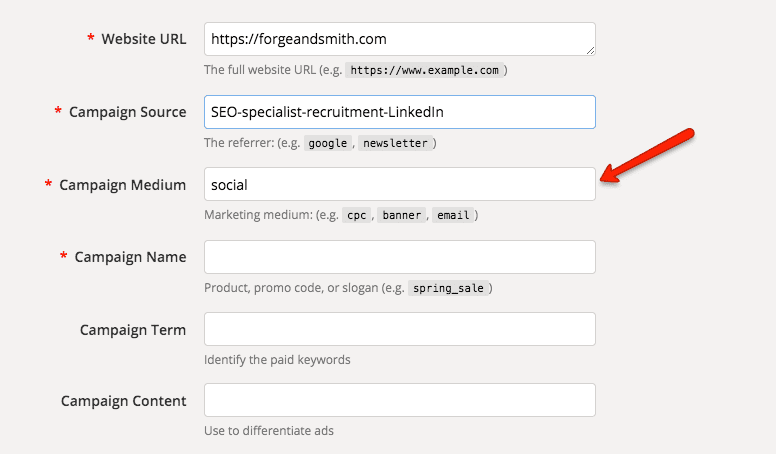
Once you’re done, your new channel grouping should look something like this:
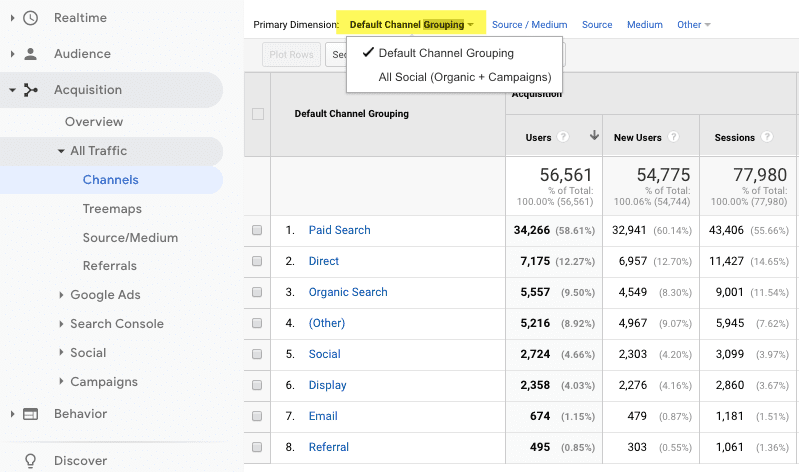
You can now find it as an option in your Acquisition > All Traffic > Channels report!
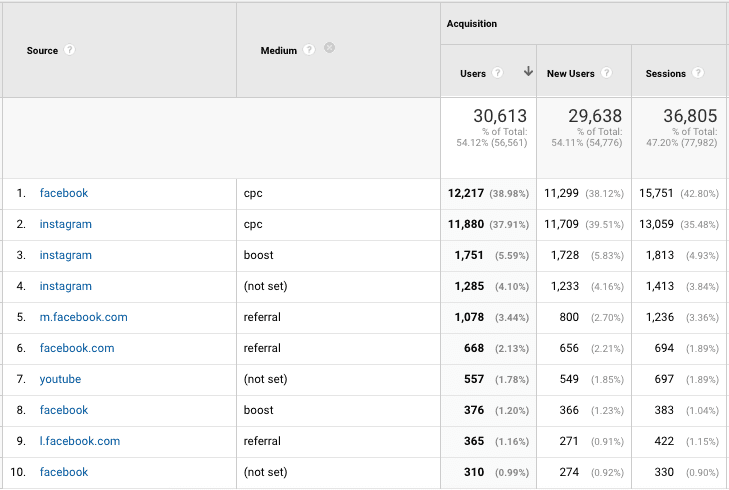
Choose your date range and any secondary dimension you like, and look at that: all your social traffic, for real this time.
I hope these advanced Google Analytics hacks have helped you discover more – and more accurate – data. After all, data drives a successful digital strategy to support your business website!


